
- Istio an introduction
- Getting started with Istio
- Istio in Practice – Ingress Gateway
- Istio in Practice – Routing with VirtualService
- Istio out of the box: Kiali, Grafana & Jaeger
- A/B Testing – DestinationRules in Practice
- Shadowing – VirtualServices in Practice
- Canary Deployments with Istio
- Timeouts, Retries and CircuitBreakers with Istio
- Authentication in Istio
- Authorization in Istio
- Istio series Summary
Istio features out of the box
By intercepting all network communication Istio is fed with metrics and data that can be used to gain observability of the whole application. Kiali, an open source project uses this data to provide the answer to the question: What microservices are part of my Istio service mesh and how are they connected?
Kiali – Observability
Before installing Istio in our cluster we created a secret for kiali (and another for grafana) where we specified that both user and password are admin. To access Kiali’s Admin UI execute the command below:
$ kubectl port-forward \
    $(kubectl get pod -n istio-system -l app=kiali \
    -o jsonpath='{.items[0].metadata.name}') \
    -n istio-system 20001
And open http://localhost:20001/ login using “admin” (without quotes) for user and password. There is a ton of useful features, like checking the configurations of Istio Components, visualizing services according to the information collected by intercepting network requests. (i.e. it answers who is calling who, which version of a service has failures etc.). Take some time to checkout Kiali before moving on to the next goodie, visualizing the metrics collected by Grafana!

Grafana – Metrics Visualization
The metrics collected by Istio are scraped into Prometheus and visualized using Grafana. To access the Admin UI of Grafana execute the command below and open http://localhost:3000.
$ kubectl -n istio-system port-forward \
    $(kubectl -n istio-system get pod -l app=grafana \
    -o jsonpath='{.items[0].metadata.name}') 3000
On the top left click the menu Home and select Istio Service Dashboard and on the top left corner select the service starting with sa-web-app, you will be presented with the collected metrics, as seen on the image below:
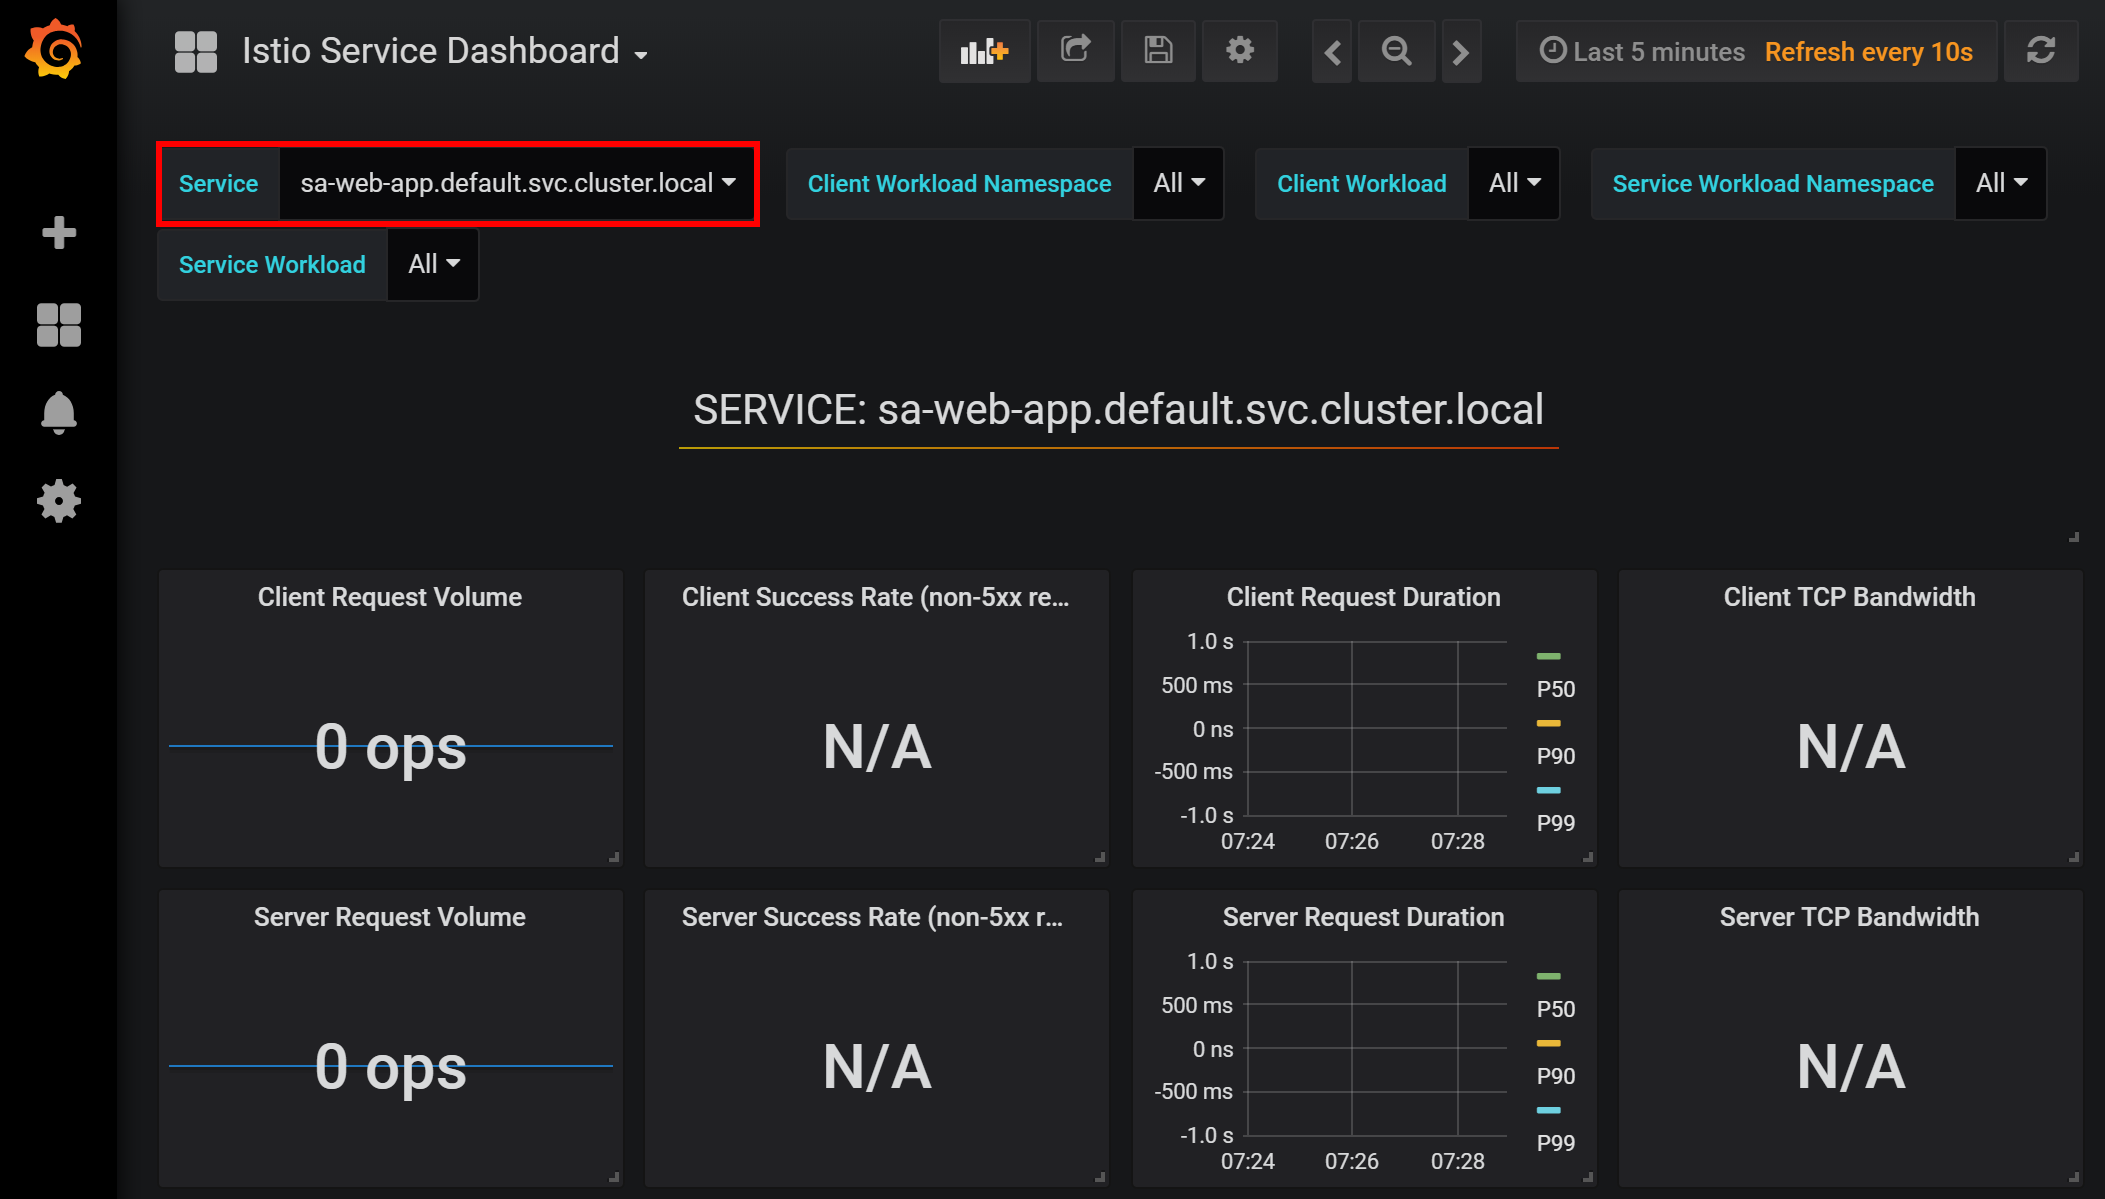
Holly molly that’s an empty and totally non-exciting view. Let’s cause some load by executing the command below:
$ while true; do \
    curl -i http://$EXTERNAL_IP/sentiment -H "Content-type: application/json" \
    -d '{"sentence": "I love yogobella"}' \
    --silent -w "Time: %{time_total}s \t Status: %{http_code}\n" -o /dev/null; \
    sleep .8; done
Now we have prettier graphs to show to the management! And additionally (though less importantly) we have the amazing tools of Prometheus for monitoring and Grafana for visualizing the metrics that enables us to know the performance, health and the improvement or degradation of our services throughout time!
Note: Leave the above command running as it will be important for upcoming sections.
Lastly, we will investigate Tracing requests throughout services.
Tracing
The more services we have the harder it gets to pinpoint the cause of failure. Let’s take the simple case in the image below:
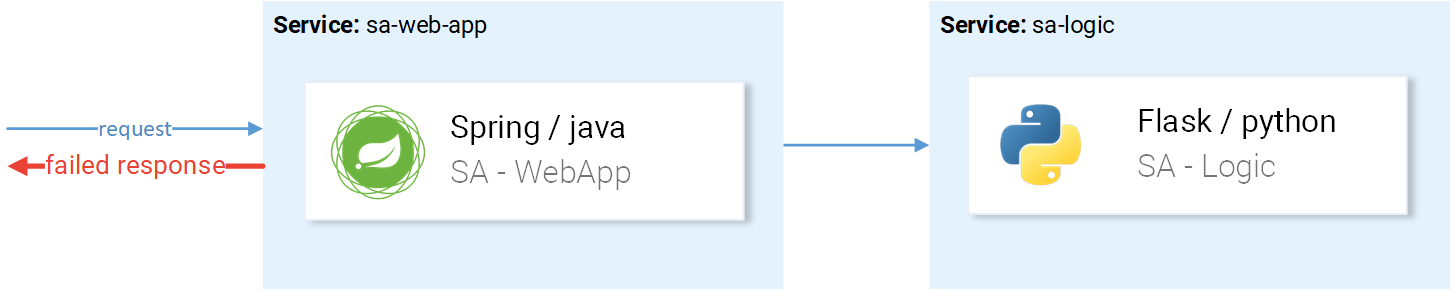
The request goes in, failure goes out, what was the cause? The first service? Or the second? Exceptions are in both, Let’s get to the logs of each. How many times do you find yourself doing this? Our job feels more like Software Detectives than Developers.
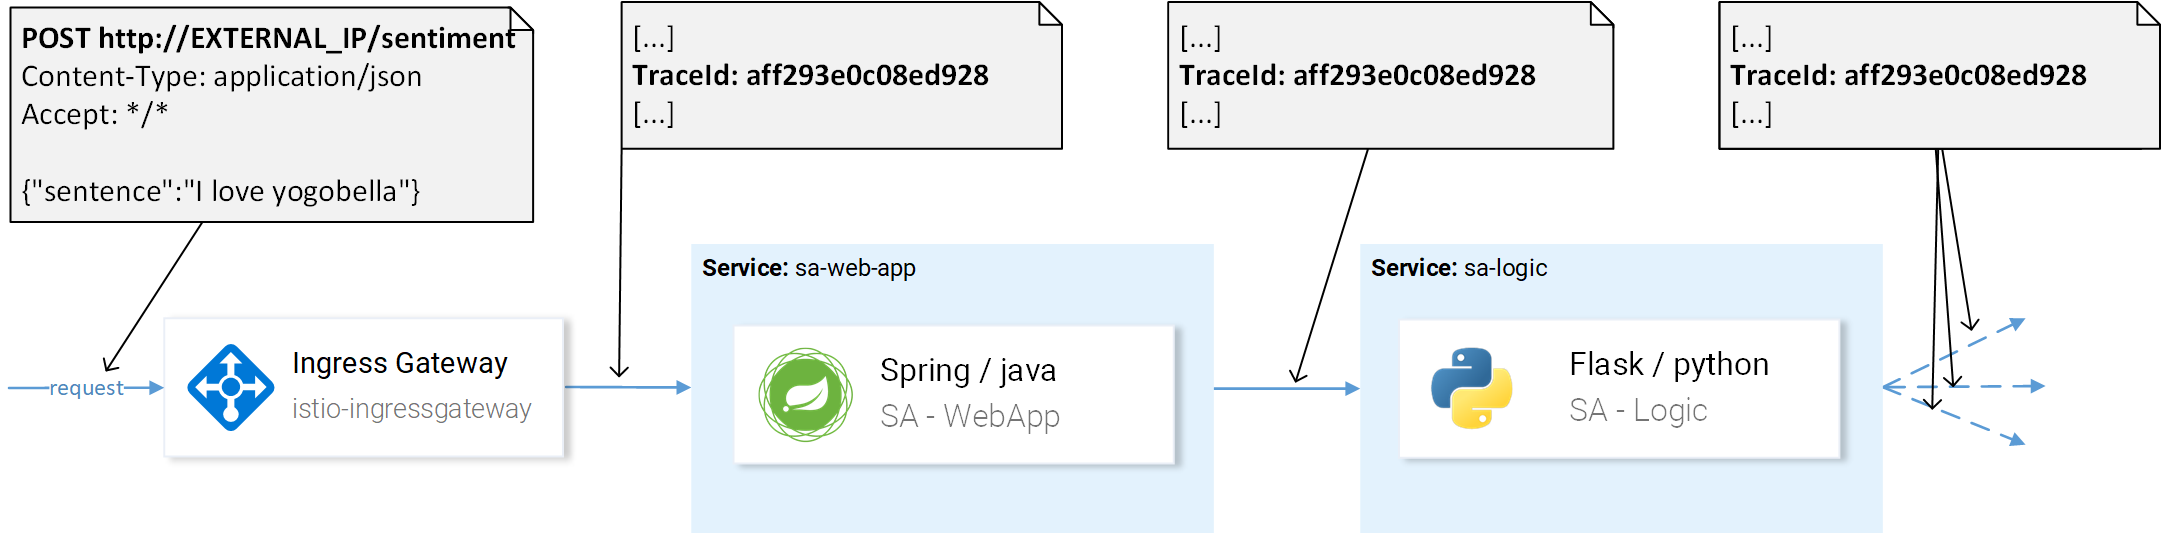
That said this is a prevalent problem in Microservices and it’s solved using Distributed Tracing Systems where the services pass a unique header to each other and then this information is forwarded to the Distributed Tracing System where the request trace is put together. An example is presented in figure 4.
In Istio tracing is supported by the Jaeger Tracer that implements the OpenTracing API, a vendor-neutral framework. To get access the Jaegers UI execute the command below:
$ kubectl port-forward -n istio-system \
    $(kubectl get pod -n istio-system -l app=jaeger \
    -o jsonpath='{.items[0].metadata.name}') 16686
Then open the UI in http://localhost:16686, select the sa-web-app service, if the service is not shown on the dropdown generate some activity on the page and hit refresh. Afterward click the button Find Traces, which displays the most recent traces, select any and a detailed breakdown of all the traces will be shown, as presented in figure 5.
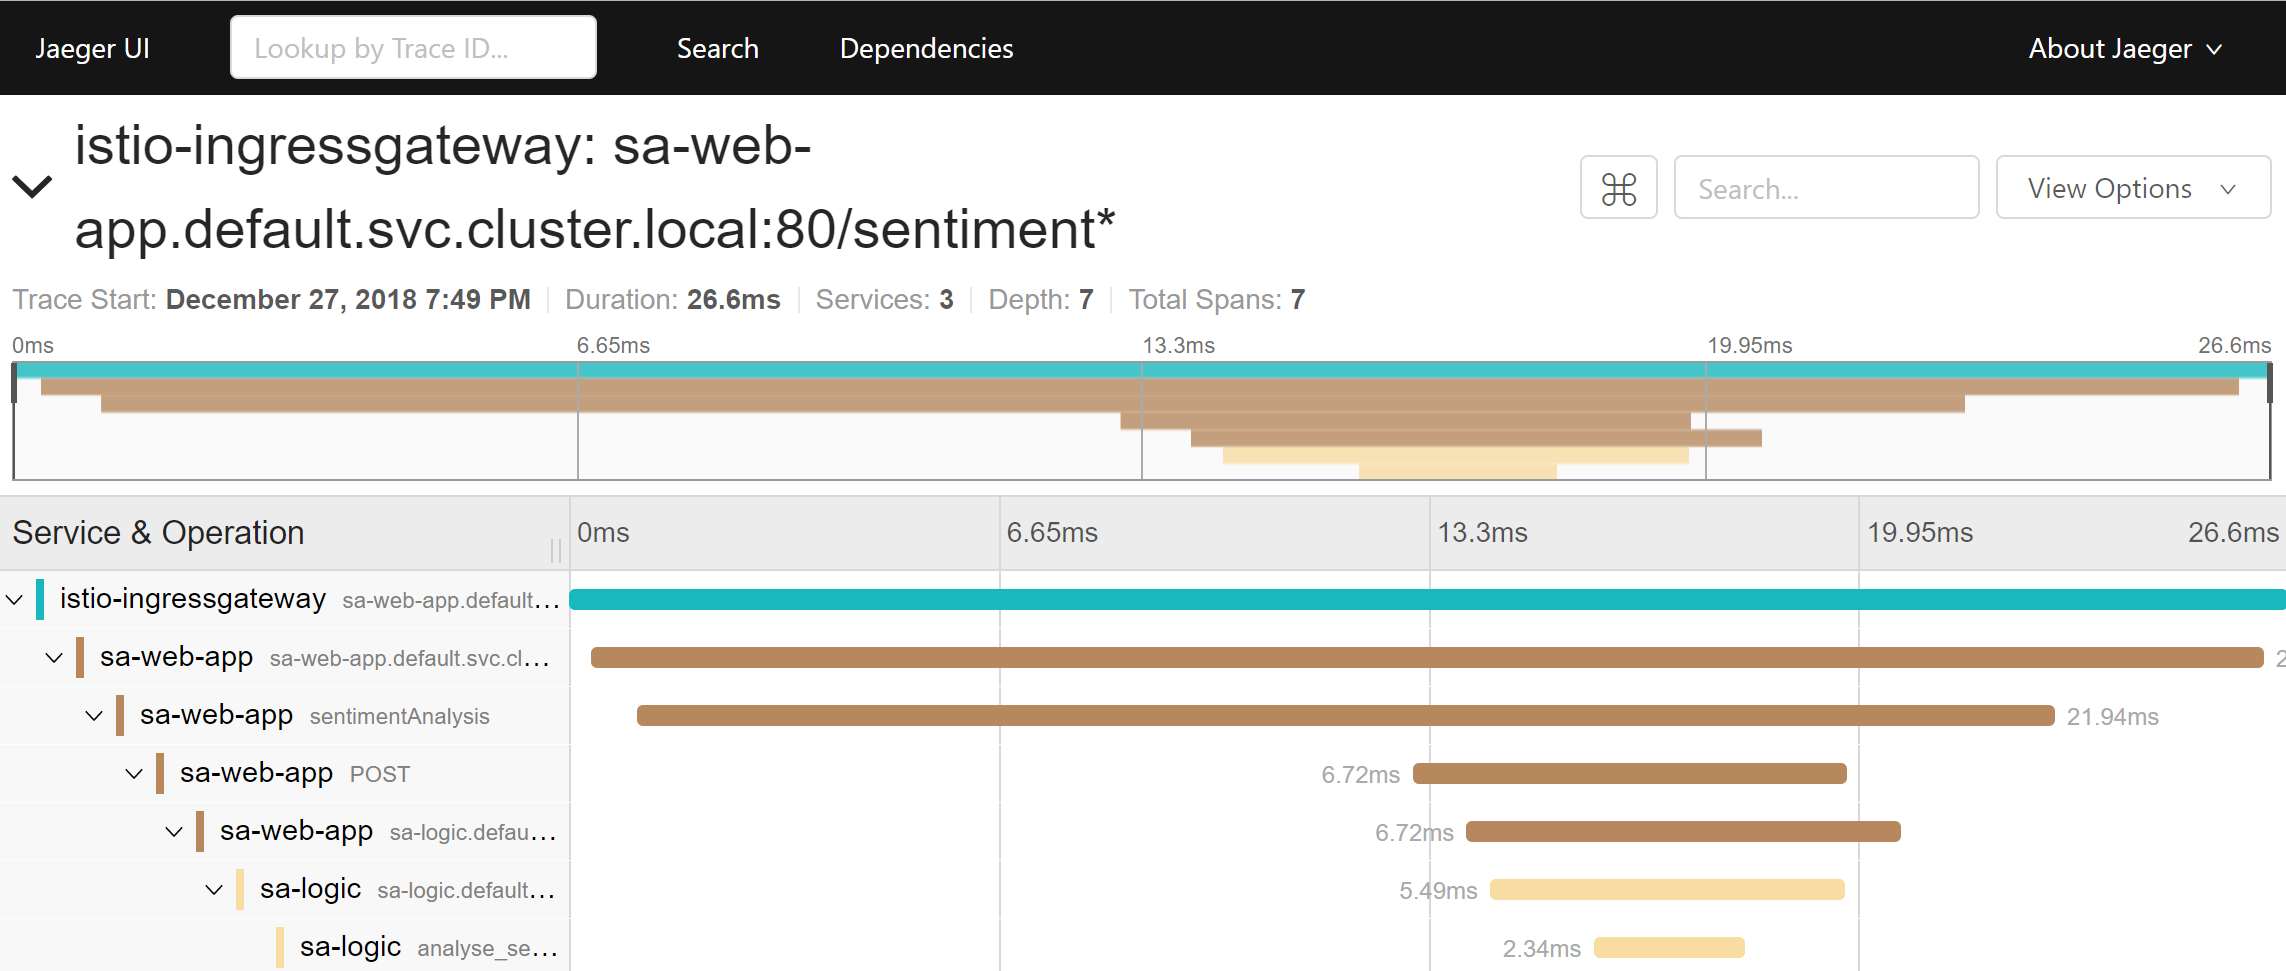
The trace shows:
- The request comes to the istio-ingressgateway (it’s the first contact with one of the services so the Trace ID is generated) then the gateway forwards the request to the sa-web-app
- In the sa-web-app service the request is picked up by the Envoy container and a span child is created (that’s why we see It in the traces) and forwarded to the sa-web-app
- Here the method sentimentAnalysis handles the request. These traces are generated by the application, meaning that code changes were required).
- From where a POST request is started to sa-logic. Trace ID needs to be propagated by sa-web-app.
- …
Note: At the 4th point our application needs to pick up the headers generated by Istio and pass them down on the next requests. This is shown in figure 6. where our application was responsible to propagate the headers under points B.
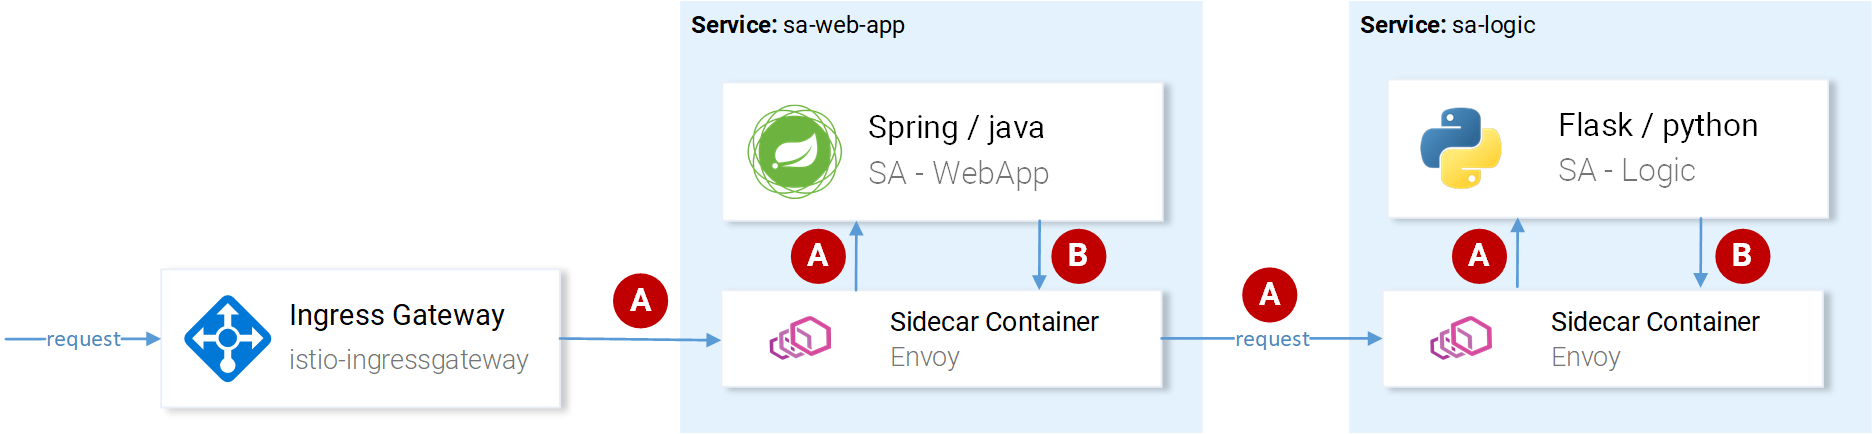
Istio does the main heavy lifting by generating the headers on incoming requests, creating new spans on every sidecar, propagating them, but without our services propagating the headers as well, the chain will be broken and the full trace will be lost.
The headers that we need to propagate are:
x-request-id
x-b3-traceid
x-b3-spanid
x-b3-parentspanid
x-b3-sampled
x-b3-flags
x-ot-span-context
Despite it being a simple task, there are already many libraries that simplify the process, for example in the sa-web-app the RestTemplate client is instrumented to propagate the headers by simply adding the Jaeger and OpenTracing libraries in the , and for getting additional application traces configuring the Environment Variables for the Jaeger Host in the Kubernetes Deployment.
Note: The Sentiment Analysis app showcases implementations for Flask, Spring and ASP.NET Core.
Now after investigating what we get out of the box (and partially out of the box 😜) let’s get to the main topic here, fine-grained routing, managing network traffic, security and more!
If you enjoyed the article, please share and comment below!